May 28, 2025
Anatomy of Exposure: Mapping Victims in a Credential Theft Epidemic
- Credential compromises are most prevalent on gaming platforms, which account for 19% of all infections.
- The data highlights Gmail's overwhelming presence in the email space, claiming a dominant share of 72.25% among the top 100 most affected domains.
- 58% of compromised email providers were regional ones.

Jacobo Blancas
Threat Intelligence Unit

Beatriz Pimenta
Threat Intelligence Unit
Introduction
Since the inception of Zynap and as one of our business pillars, our analysts have been collecting leaked credentials from numerous sources. With the launch of our blog today – where we will share many more insights from our exploration of the underground ecosystem - we will present an overview and analysis of the most interesting findings from our malware-compromised credentials collection during the latter half of January 2025. For this purpose, we selected a sample of 1.2 billion credentials to guide our analysis.
In this blogpost, we are sharing the following statistics with our readers:
- Average password byte strength
- Most affected domains
- Common username domains
- Analysis of infected devices: IPs and device type
As we continue to explore the evolving trends in credential theft and leakage, this blog will serve as a platform to discuss key insights from our ongoing research. These findings shed light on crucial aspects of the ongoing challenges in cybersecurity, offering a closer look at the specificities of compromised credentials, their potential implications, and a brief profiling of the victims.
Statistics
Exploring the most affected domains
The first statistic we would like to be able to visualize when analyzing collected credentials is what sort of platform is getting more compromised. Upon analyzing each one of the domains, we noticed some patterns, and we share below our findings regarding the most affected sectors:
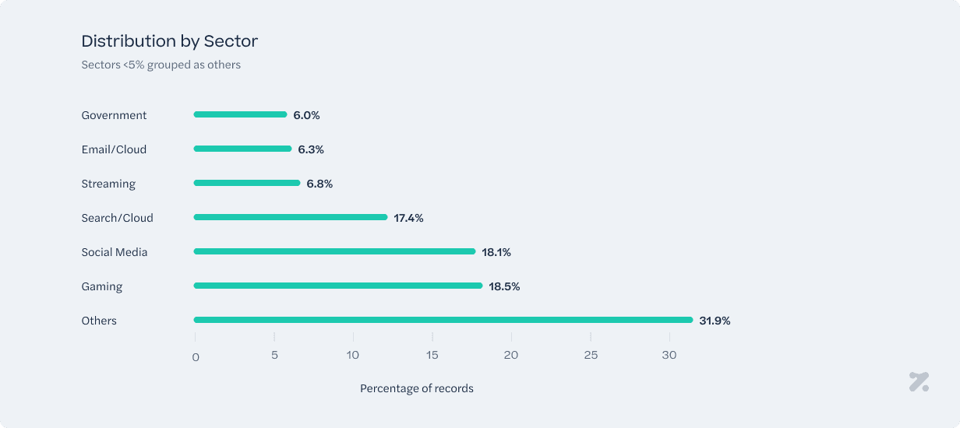
Gaming platforms are the most affected when it comes to the compromise of credentials, accounting for 19% of all infections. Among these, Roblox ranked in the top 3 most affected platforms – representing, alone, 6.5% of all compromised credentials in the period. These findings led us to formulate a few hypotheses. Unlike other gaming platforms, Roblox is primarily used by children. According to the latest demographic statistics, 58% of Roblox daily users are younger than 16 years old1. Therefore, one hypothesis is that the high number of compromised credentials resulting from infostealer infections is linked to children's online behavior. While infection vectors require further analysis, it is likely that these users search for hacks on Discord and YouTube, inadvertently infecting their devices. Recent studies234 from industry peers support this theory. Furthermore, considering that many children play on their parents' or family devices—where other sensitive credentials, such as banking and corporate logins, are stored—the potential exposure and risk become even more concerning. Roblox infections might serve as an entry point for broader security threats affecting entire households.
Unsurprisingly, another platform that was immensely affected by credential theft was Facebook, accounting for 11.7% of total infections. With over 3 billion global users5, it is expected that a portion of Facebook users would be vulnerable to credential theft, making it a significant contributor to global credential compromises.
Although no government platforms appear in the top 10 most affected individually, catches the eye that the government sector ranks as the second most affected when it comes to the number of incidents in our analysis. This is due to the fact that the analysis considered all affected categories, creating a top 10 ranking without factoring in the percentage of compromised credentials each incident contributed to the total. As a result, even though the number of affected credentials was relatively low, the government sector still appeared with multiple affected platforms, underscoring a critical risk for citizens with potentially severe implications for the CIA triad (confidentiality, integrity, and availability) of information security. We identified multiple affected domains from the Indian and Brazilian governments, with governmental portals from 9 countries in total being impacted. Notably, 6 of these countries are in Latin America, revealing both a significant security gap in government information security management and a regional trend.
Analysis of domain patterns in usernames
Digging deeper into our research, we’ve decided to extract the most common domains from the compromised accounts. As expected, major email providers rank first in the top 10 of most affected domains, as shown in the graph below:
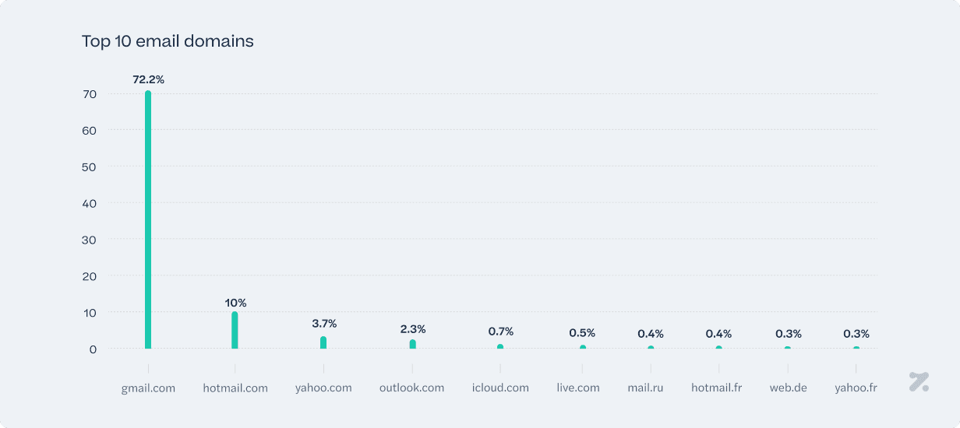
The statistics reveal a clear dominance of Gmail in the email landscape, accounting for a substantial 72.25% of the top 100 usernames. Considering that Gmail has approximately 1,8 billion users6, and Hotmail—the second-ranked provider—has about a fifth of that with 400 million users7, the distribution of percentages seems somewhat consistent but not perfectly proportional. This suggests that the frequency of Gmail's occurrences is disproportionately high relative to its user base compared to Hotmail. The high affectation of Gmail accounts could be linked to their integration with Google services and their use as an authentication method for logging into many other platforms. However, these remain unconfirmed and are hypotheses proposed to explain the observed disproportion.
Additionally, regional preferences are evident with providers: out of the top 100, 58 domains are regional domains, with a dominance of French, Dutch, and German providers. Legacy providers maintain a presence, albeit much smaller, pointing to the continued use of older email services in certain demographics or regions.
In the top 100 domains, we could not locate any specific provider that could refer to a governmental entity or a corporate domain. This leads us to conclude that there was no major corporate breach in the period analyzed, which would make corporate domains peak in our results. The collected credentials follow an expected pattern of types of compromised accounts that are used for everyday personal purposes.
Password bit range distribution
Shifting focus from the compromised credentials to the exposed passwords, we decided to check out the strength of the affected password. Here’s what we discovered:
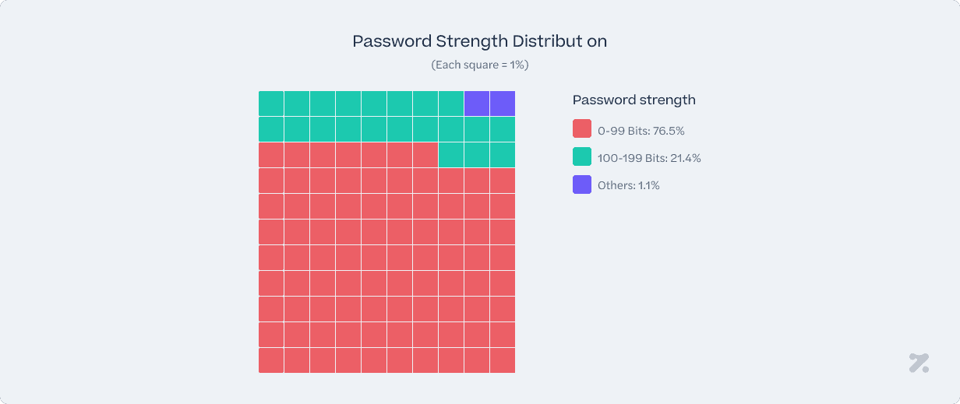
As 77% of analyzed compromised credentials fall into the 0-99 bit password range, it means that the majority of affected passwords are not only the very weak ones but also include some that might be perceived as reasonably secure. However, although some of the compromised users have strong password policies enforced (the ones from the 80-99 bits range), they are still rather vulnerable when it comes to information-stealing malware. Even though the user can be safe from brute-forcing attacks, other types of advanced threats can still compromise their accounts, who must also enforce other security measures to truly safeguard their privacy.
Overall, these statistics highlight a significant gap in password security, with a large number of users relying on weaker/standard passwords that could be easily exploited. It also indicates that, while stronger passwords are a step in the right direction, they alone are not enough to fully protect users from the increasing sophistication of cyber threats. This reinforces the need for multi-layered security strategies, such as multi-factor authentication and regular system security updates, in addition to improving password strength.
Infection distribution analysis
In the second phase of our research, additional information allowed us to further profile the victims. The goal here was to analyze the infections themselves by drawing conclusions from the compromised credentials we had gathered.
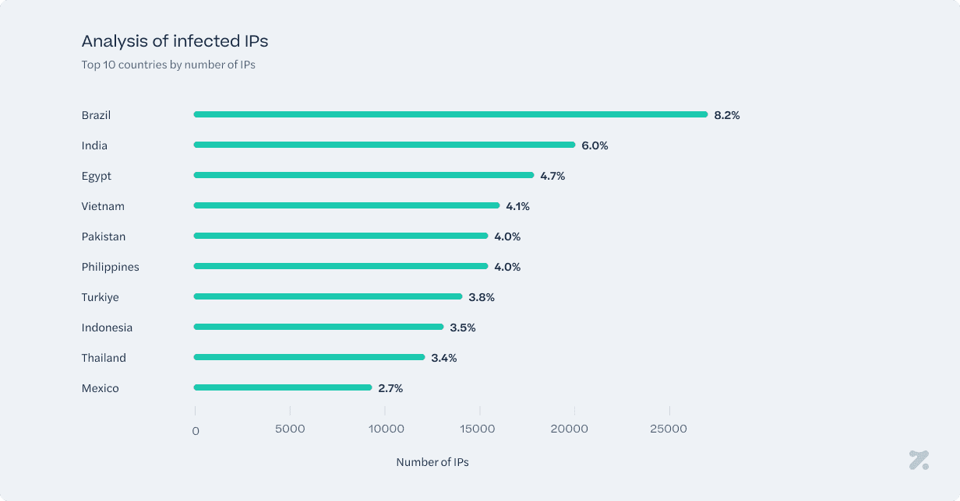
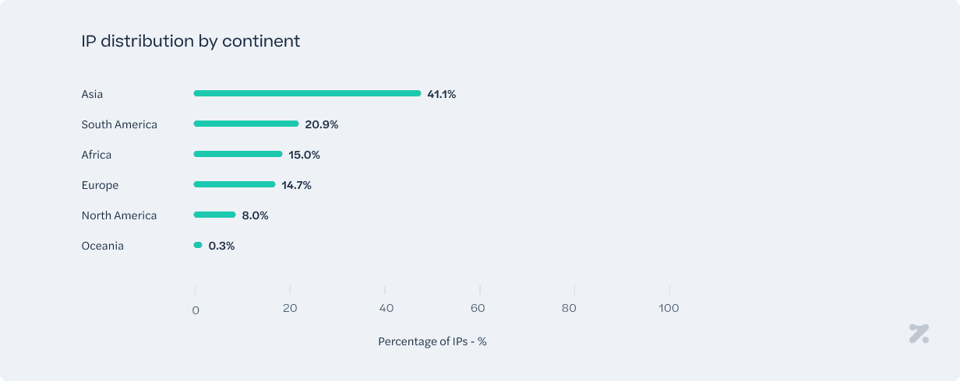
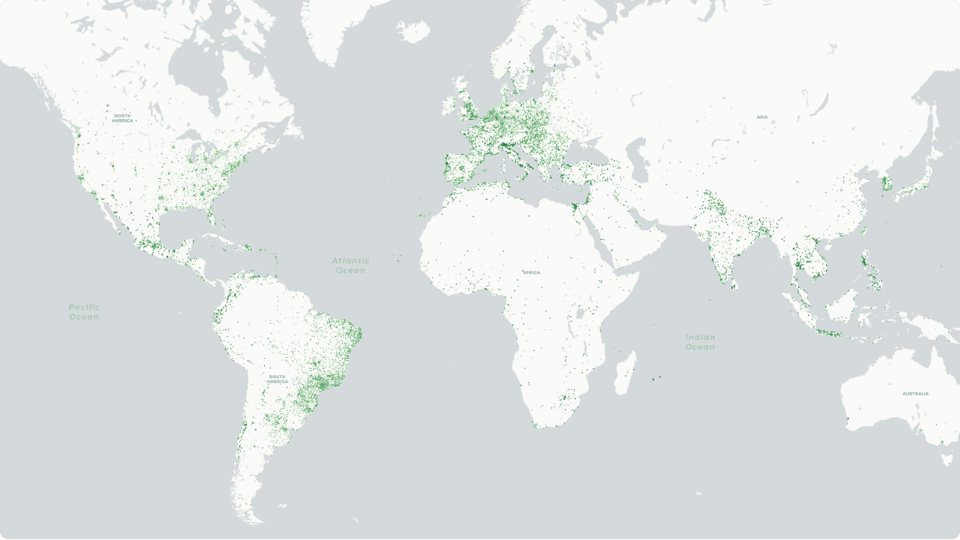
A discernible cluster of infected IPs appears across several populous countries: 7 of the most impacted countries figure in the top 15 most populated countries globally8. This indicates that the infostealer’s spread may correlate with larger internet user bases and high traffic volumes. Certain regions stand out with a significantly higher concentration of suspected infections, suggesting localized factors—such as prevalent software vulnerabilities, popular messaging apps, or specific usage patterns—that facilitate the malware’s propagation. As a point of interest, in the section analyzing the most affected platforms, we highlighted the prevalence of compromised accounts linked to the Indian and Brazilian governments. Not coincidentally, Brazil and India also rank among the top two countries with the most infected IPs by infostealers.
The distribution spans hundreds of nations, in over 16,800 cities, signaling a widespread presence rather than being confined to a few local hotspots. This broad scope highlights how easily malware can diffuse when facilitated by ubiquitous internet connections and cross-border digital interactions. Even though certain countries exhibit higher infection ratios, smaller nations also show occurrences, underscoring that no region is entirely free from threat. Sri Lanka accounts for 1.03% of cases, while Bermuda accounts for only 0.0012%.
By analyzing the distribution of infections more in depth, we can draw some preliminary conclusions:
The spread of infostealer malware could be influenced by a combination of socioeconomic and technological factors, such as varying cybersecurity awareness, the availability of security updates, the state of cybercrime legislation and law enforcement, and predominant operating systems or software used regionally. Even cultural tendencies—like frequent sharing of files via unregulated channels or reliance on outdated hardware or software—can create additional pathways for the malware to establish itself.
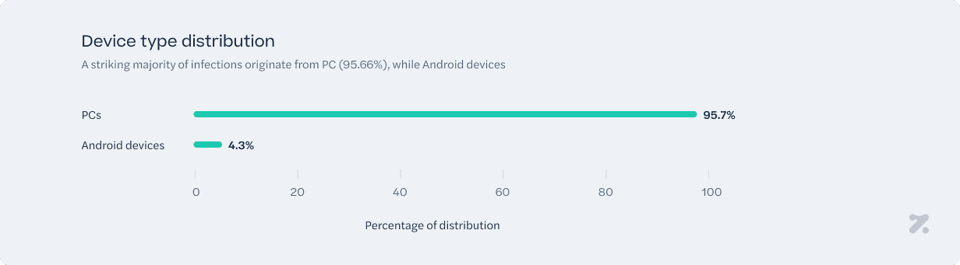
A striking majority of infections originate from PCs (95.66%), while Android devices account for a much smaller proportion (4.33%). This suggests that infostealer campaigns still overwhelmingly target desktop and laptop environments, likely due to the sensitive nature of stored credentials and the broader attack surface presented by traditional operating systems. The relatively low infection rate on Android devices could indicate greater security measures within mobile ecosystems, such as Google Play Protect and more frequent OS updates, which help limit the effectiveness of infostealer payloads. However, the presence of Android infections, while small, should not be overlooked. Mobile threats may be growing, particularly through sideloaded applications, malicious APKs, and phishing-based credential theft. Attackers may be adapting their techniques to penetrate mobile defenses more effectively.
Conclusion
The findings emphasize significant patterns in credential compromise, including the prevalence of Gmail account compromises, an increase in infections on gaming platforms such as Roblox, and the vulnerability of governmental websites, particularly in Latin America. High infostealer infection rates in Latin America further highlight regional vulnerabilities, underscoring the need to strengthen cybersecurity measures.
But this is not the end of the story. We have decided to investigate the credential theft ecosystem in detail, and our next endeavor is to explore the business model, studying the potential costs and earnings of launching a credential theft campaign. Stay tuned!
BLOG